A nationwide study was done to assess the programming proficiency of students taking a statistical programming class.The students were asked their proficiency in the statistical software SAS.The survey was sent to students at over 100 universities and 112 responses were received from 21 different universities.The results were published in the journal International Mathematical Forum in 2011.The results in the form of a pie chart are shown below. 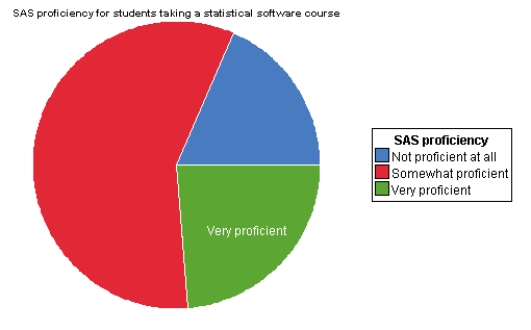 From the pie chart,we can see that most students are _____.
A) not proficient at all
B) somewhat proficient
C) very proficient
Correct Answer:
Verified
Q78: Malaria is a leading cause of infectious
Q79: According to the American Cancer Society,the decline
Q80: Malaria is a leading cause of infectious
Q81: As part of a large ongoing study
Q82: The bar graph below represents the highest
Q84: The bar graph below represents the highest
Q85: The bar graph below represents the highest
Q86: On the first day of class,statistics professors
Q87: Which of the following variables is quantitative?
A)The
Q88: The median age of five people in
Unlock this Answer For Free Now!
View this answer and more for free by performing one of the following actions

Scan the QR code to install the App and get 2 free unlocks

Unlock quizzes for free by uploading documents