A nationwide study was done to assess the programming proficiency of students taking a statistical programming class.The students were asked their proficiency in the statistical software SAS.The survey was sent to students at over 100 universities and 112 responses were received from 21 different universities.The results were published in the journal International Mathematical Forum in 2011.The results in the form of a pie chart are shown below. 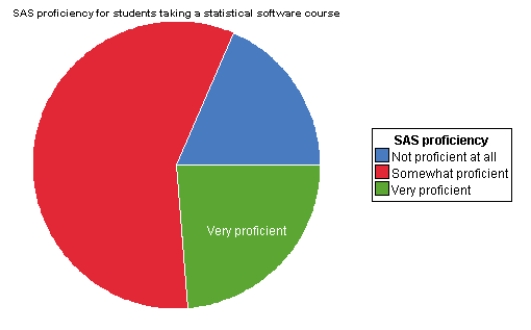 True or False.A bar graph would give the same information?
Correct Answer:
Verified
Q84: The bar graph below represents the highest
Q85: The bar graph below represents the highest
Q86: On the first day of class,statistics professors
Q87: Which of the following variables is quantitative?
A)The
Q88: The median age of five people in
Q90: On the first day of class,statistics professors
Q91: The bar graph below represents the highest
Q92: The World Malaria Report (2008)has information on
Q93: The Environmental Protection Agency records data on
Q94: The World Malaria Report (2008)has information on
Unlock this Answer For Free Now!
View this answer and more for free by performing one of the following actions

Scan the QR code to install the App and get 2 free unlocks

Unlock quizzes for free by uploading documents