The following chart shows a relationship between advertising expenditures and sales. 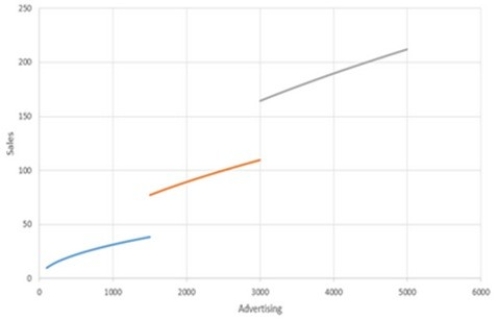
Which of the following describes the chart in terms of a linear relationship?
A) The chart shows a linear relationship.
B) The chart shows decreasing marginal returns.
C) The chart shows a proportional relationship.
D) The chart shows discontinuities.
E) The chart is piecewise linear.
Correct Answer:
Verified
Q44: If a model uses IF or ROUND
Q45: One reason that a manager may choose
Q46: The measure of risk for pairs of
Q47: A nonlinear function may contain which of
Q48: Which of the following techniques is appropriate
Q50: The measure of risk in a portfolio
Q51: Which of the following can be part
Q52: A nonlinear programming problem may have:
I. Activities
Q53: Evolutionary Solver is based on which of
Q54: The following chart shows a relationship between
Unlock this Answer For Free Now!
View this answer and more for free by performing one of the following actions

Scan the QR code to install the App and get 2 free unlocks

Unlock quizzes for free by uploading documents