The following chart shows a relationship between advertising expenditures and sales. 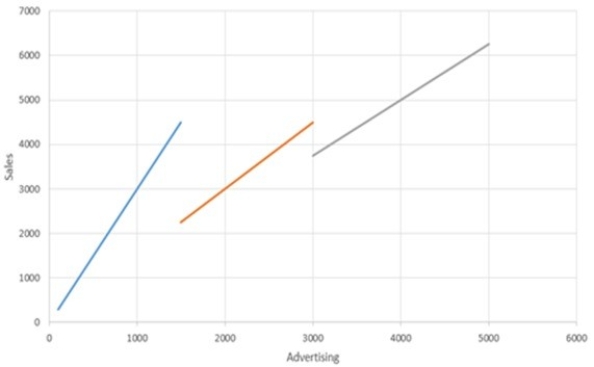 Which of the following describes the chart in terms of a linear relationship?
A) The chart shows a linear relationship.
B) The chart shows decreasing marginal returns.
C) The chart shows a proportional relationship.
D) The chart shows increasing marginal returns.
E) The chart is piecewise linear.
Correct Answer:
Verified
Q37: The risk for a portfolio is decreased
Q38: When there are decreasing marginal returns:
A) the
Q39: Evolutionary Solver is often faster than the
Q40: Mutation is the technique used to create
Q41: Decreasing marginal returns violates which assumption of
Q43: Separable programming will always find the optimal
Q44: If a model uses IF or ROUND
Q45: One reason that a manager may choose
Q46: The measure of risk for pairs of
Q47: A nonlinear function may contain which of
Unlock this Answer For Free Now!
View this answer and more for free by performing one of the following actions

Scan the QR code to install the App and get 2 free unlocks

Unlock quizzes for free by uploading documents