Life Expectancy Narrative
An actuary wanted to develop a model to predict how long individuals will live. After consulting a number of physicians, she collected the age at death (y), the average number of hours of exercise per week (  ), the cholesterol level (
  ), and the number of points that the individual's blood pressure exceeded the recommended value (
  ). A random sample of 40 individuals was selected. The computer output of the multiple regression model is shown below.
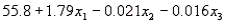
The regression equation is 
 S = 9.47 R-Sq = 22.5%
Analysis of Variance 
-Refer to Life Expectancy Narrative. Is there enough evidence at the 5% significance level to infer that the cholesterol level and the age at death are negatively linearly related? Justify your conclusion.
Correct Answer:
Verified
Rejection region: t < -
View Answer
Unlock this answer now
Get Access to more Verified Answers free of charge
Q209: Demographic Variables and TV Narrative
A statistician wanted
Q210: Demographic Variables and TV Narrative
A statistician wanted
Q211: Air Pollution Monitors Narrative
An experiment was designed
Q212: Air Pollution Monitors Narrative
An experiment was designed
Q213: Life Expectancy Narrative
An actuary wanted to develop
Q215: Life Expectancy Narrative
An actuary wanted to develop
Q216: Life Expectancy Narrative
An actuary wanted to develop
Q217: Air Pollution Monitors Narrative
An experiment was designed
Q218: Life Expectancy Narrative
An actuary wanted to develop
Q219: Demographic Variables and TV Narrative
A statistician wanted
Unlock this Answer For Free Now!
View this answer and more for free by performing one of the following actions

Scan the QR code to install the App and get 2 free unlocks

Unlock quizzes for free by uploading documents