Soft Drink Sales Narrative
A soft drink distributor was interested in examining the relationship between the number of ads (x) for his product during prime time on a local television station and the number of sales per week (y) in 1000s of cases. She compiled the figures for 20 weeks and computed the following summary information: n = 20, 

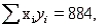
 and
and  .
.
-Refer to Soft Drink Sales Narrative. Find the best-fitting line relating the number of ads during prime time and weekly sales.
Correct Answer:
Verified
View Answer
Unlock this answer now
Get Access to more Verified Answers free of charge
Q47: Soft Drink Sales Narrative
A soft drink distributor
Q48: Weekly Amount Spent on Groceries Narrative
The number
Q49: Meet Your Match Media Narrative
The Executive Board
Q50: Gasoline Prices and Fuel Efficiency Narrative.
When the
Q51: Meet Your Match Media Narrative
The Executive Board
Q52: Gasoline Prices and Fuel Efficiency Narrative.
When the
Q53: Gasoline Prices and Fuel Efficiency Narrative.
When the
Q54: Students' GPA Narrative
A law school administrator was
Q56: Weekly Amount Spent on Groceries Narrative
The number
Q57: Students' GPA Narrative
A law school administrator was
Unlock this Answer For Free Now!
View this answer and more for free by performing one of the following actions

Scan the QR code to install the App and get 2 free unlocks

Unlock quizzes for free by uploading documents