Figure 20.8 below shows 10-year bond yields for Japan and the United States between 2006 and 2015. Given the data, what does the short-run nominal exchange rates model suggest should happen to the Japanese yen-U.S. dollar exchange rate? What other factor(s) might affect the exchange rate other than bond yields?Figure 20.8: Japanese and U.S. 10-Year Bond Yields 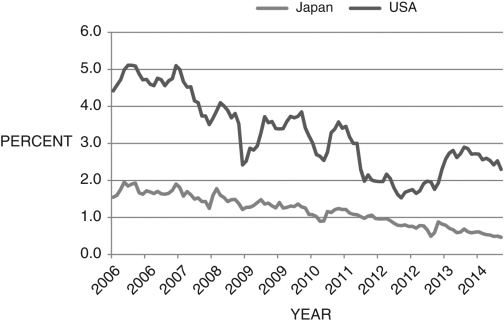
Correct Answer:
Verified
View Answer
Unlock this answer now
Get Access to more Verified Answers free of charge
Q119: In Europe, domestic lending by banks fell
Q120: Prior to the introduction of the euro,
Q121: Consider Figure 20.6 below, which shows the
Q122: The end of the Bretton Woods standard
Q123: The following best describes the relationship between
Q125: When we include the interest rate gap
Q126: If Mexico wants to fix the peso
Q127: To extend the short run to include
Q128: The reason that the law of one
Q129: The Mexican peso crisis was precipitated, in
Unlock this Answer For Free Now!
View this answer and more for free by performing one of the following actions

Scan the QR code to install the App and get 2 free unlocks

Unlock quizzes for free by uploading documents