Figure 18.4 below shows bond yields on U.S., Japanese, and German 10-year bonds, 1997-2014. The gray shaded areas represent Japanese recession dates. During this period the U.S. had two official recessions: one in 2001 and one from 2008-2009. Given this information and what you know about Japanese and American debt-to-GDP ratios, explain the reason(s) for the differences in Japanese and American bond yields.Figure 18.4: Japan and USA 10-Year Bond Yields and Japanese Recession Dates: 1997-2014 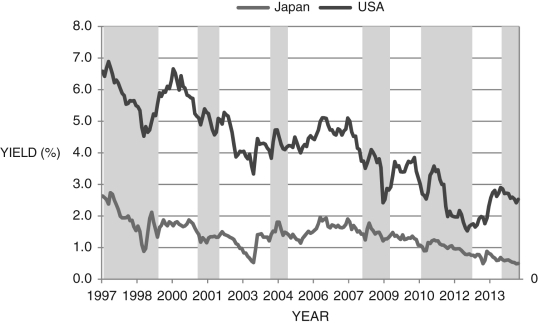
Correct Answer:
Verified
View Answer
Unlock this answer now
Get Access to more Verified Answers free of charge
Q110: The national income identity can be rearranged
Q111: According to the law of diminishing returns,
Q112: Argentina, Mexico, and Brazil have all defaulted
Q113: Write down the government's budget constraint. Be
Q114: We can compensate future generations for the
Q116: If a government has a difficult time
Q117: In 1956, the Federal-Aid Highway Act of
Q118: What is Norway's debt-to-GDP situation? Why? Given
Q119: Figure 18.5 below shows German and Italian
Q120: During which period did the United States
Unlock this Answer For Free Now!
View this answer and more for free by performing one of the following actions

Scan the QR code to install the App and get 2 free unlocks

Unlock quizzes for free by uploading documents