Refer to the following figure when answering the following questions.
Figure 17.2: Dow Jones Industrial Average: 2000-2012 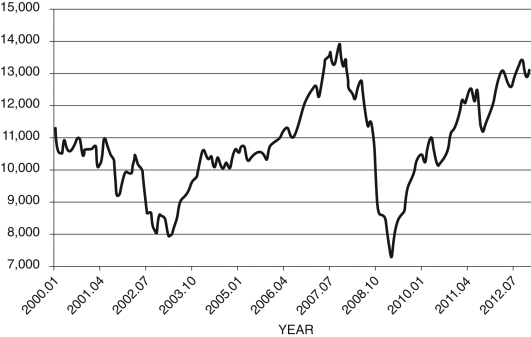 (Source: Federal Reserve Economic Data, St. Louis Federal Reserve)
-Your grandmother is a follower of the financial press and decides to quiz you about your knowledge of financial markets. She asks you to explain the price of stock prices based on the financial capital arbitrage equation. She shows you the graph shown in Figure 17.2. She asks you to explain the cause in the rise of stock prices for the years 2008-2012. What do you tell her?
A) "The graph suggests there are capital losses in financial markets, so to cover these losses, stock prices have to rise."
B) "Grandma, I was an art major and didn't have to take finance or economics classes."
C) "Ironically, falling capital gains have no impact on stock prices."
D) "A falling DJI leads to negative capital gains in financial assets. This, in turn, drives stock prices down."
E) "Because, in equilibrium, the real interest rate, capital gains, and dividends move in tandem, the decline in stock prices is due to 'irrational exuberance.'"
Correct Answer:
Verified
Q42: Refer to the following figure when answering
Q43: If the bank real interest rate is
Q44: Which of the following represents the financial
Q45: In 2001, the P/E ratio:
A) led to
Q46: If the real interest rate is, more
Q48: If we divide both sides of the
Q49: Since 1980, interest rates have been trending
Q50: If the savings interest rate rises, to
Q51: Between 1880 and 2015, the average P/E
Q52: The payment the owner of a stock
Unlock this Answer For Free Now!
View this answer and more for free by performing one of the following actions

Scan the QR code to install the App and get 2 free unlocks

Unlock quizzes for free by uploading documents