Refer to the following figure when answering the following questions.
Figure 16.5: U.S. Household Net Worth 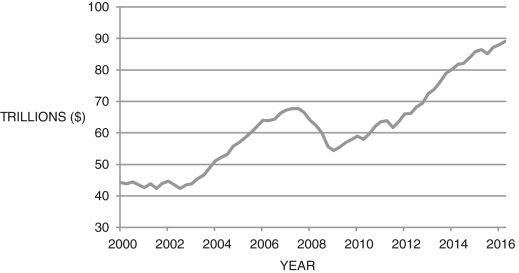
-Based on Figure 16.5, personal savings generally ________ over the period. However, personal savings ________ between roughly 2007 and 2009, which was likely due to ________.
A) fell; rose; precautionary savings
B) fell; fell; negative interest rates
C) rose; rose; an increase in interest rates
D) rose; rose; the wealth effect
E) fell; rose; higher gas prices
Correct Answer:
Verified
Q68: Because people cannot perfectly foresee income changes
Q69: If the government lowers taxes to stimulate
Q70: Behavioral economics blends economics with:
A) psychology.
B) marketing.
C)
Q71: Figure 16.3: Daily Returns to Jim-Bob's Spark
Q72: Figure 16.3: Daily Returns to Jim-Bob's Spark
Q74: Precautionary savings lead households to act as
Q75: Between 1970 and 2008, household consumption _
Q76: If an individual has no access to
Q77: Individuals who have restricted access to credit
Q78: One of the findings of studies in
Unlock this Answer For Free Now!
View this answer and more for free by performing one of the following actions

Scan the QR code to install the App and get 2 free unlocks

Unlock quizzes for free by uploading documents