Figure 16.8: Personal Savings Rates 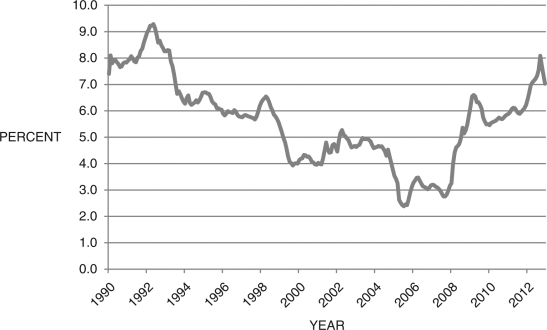 (Source: Federal Reserve Economic Data, St. Louis Federal Reserve)
-Your high school economics teacher recently saw the graph of personal savings rates above. She knows you are taking economics in college and is curious to hear your opinion about what is causing the general trends in savings rates from 1990-2012. What do you tell her?
Correct Answer:
Verified
View Answer
Unlock this answer now
Get Access to more Verified Answers free of charge
Q98: Consider consumption in two periods, 
Q99: When applied to the first President Bush's
Q100: In the intertemporal budget Q101: Consider Figure 16.7 below, which shows the Q102: Consider Figure 16.9 below, which shows household Q104: You are currently an economics major Q105: Consider Figure 16.10 below, which shows household Q106: A widely used utility function in Q107: Consider Figure 16.11 below, which shows household Q108: In 1992, the first Bush administration was![]()
Unlock this Answer For Free Now!
View this answer and more for free by performing one of the following actions

Scan the QR code to install the App and get 2 free unlocks

Unlock quizzes for free by uploading documents