Consider Figure 16.9 below, which shows household real income, consumption, and savings. Explain why you can see a rise in savings while both consumption and income fall in 2007-2009. Does this neoclassical model fully explain this behavior? What other effect might be influencing changes in these three macroeconomic variables?Figure 16.9: Real Household Disposable Income, Consumption, and Savings 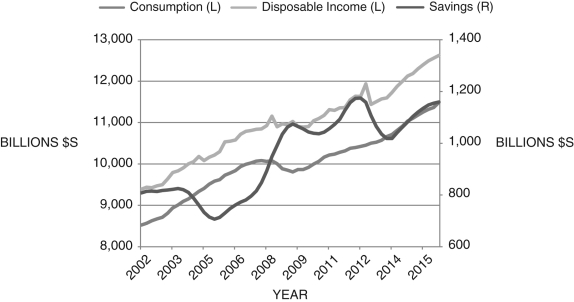
Correct Answer:
Verified
View Answer
Unlock this answer now
Get Access to more Verified Answers free of charge
Q97: Household consumption accounts for about one-half of
Q98: Consider consumption in two periods, 
Q99: When applied to the first President Bush's
Q100: In the intertemporal budget Q101: Consider Figure 16.7 below, which shows the Q103: Figure 16.8: Personal Savings Rates Q104: You are currently an economics major Q105: Consider Figure 16.10 below, which shows household Q106: A widely used utility function in Q107: Consider Figure 16.11 below, which shows household![]()
Unlock this Answer For Free Now!
View this answer and more for free by performing one of the following actions

Scan the QR code to install the App and get 2 free unlocks

Unlock quizzes for free by uploading documents