Figure 14.6: 90-Day Interbank Interest Rates for the Euro Area and the U.S. 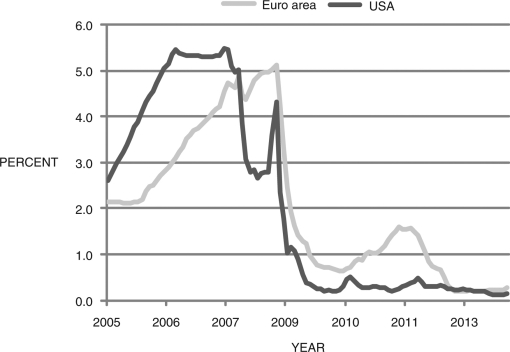 (Source: FRED II)
-Figure 14.6 shows the 90-day interbank interest rates for the euro area and the United States, 2005-2014, which are proxies for short-term sovereign debt. What does this graph say about risk in the euro area and the United States?
Correct Answer:
Verified
View Answer
Unlock this answer now
Get Access to more Verified Answers free of charge
Q102: Between January 1985 and January 1990, the
Q103: The following statement is from the October
Q104: Briefly discuss the Fed's balance sheet before
Q105: The Fed's holdings of mortgage-backed securities is
Q106: You are a newly hired reporter for
Q107: Banks that are deemed too big to
Q109: The Squam Lake Group's reform suggestions included
Q110: Your uncle is pleased to hear you
Q111: Consider Figure 14.7 below. Discuss the relationship
Q112: Consider Figure 14.9 below, which shows bank
Unlock this Answer For Free Now!
View this answer and more for free by performing one of the following actions

Scan the QR code to install the App and get 2 free unlocks

Unlock quizzes for free by uploading documents