Refer to the following figure when answering the following questions.
Figure 12.10: Output Gap: 1990-2000 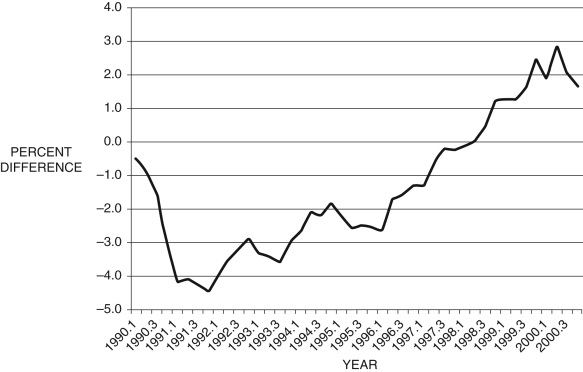
-Consider Figure 12.10, which shows the output gap  from 1990 to 2000, by quarter. If this is all the information you have, during the period 1993.1-1993.4, from the Phillips curve, you would conclude that:
A) inflation is decelerating, 0.
B) inflation is accelerating, 0.
C) unemployment is falling.
D) unemployment is rising.
E) Not enough information is given.
Correct Answer:
Verified
Q70: Which of the following statements is NOT
Q71: As lender in the last resort, the
Q72: Figure 12.7: Output Q73: The money demand curve: Q74: Refer to the following figure when Q76: Which of the following scenarios best describes Q77: The nominal interest rate: Q78: Refer to the following figure when answering Q79: Refer to the following figure when answering Q80: Which of the following statements is NOT![]()
A) slopes downward with
A) is set by
Unlock this Answer For Free Now!
View this answer and more for free by performing one of the following actions

Scan the QR code to install the App and get 2 free unlocks

Unlock quizzes for free by uploading documents