Refer to the following figure when answering the following questions.
Figure 11.1: Growth rates of real investment and consumption 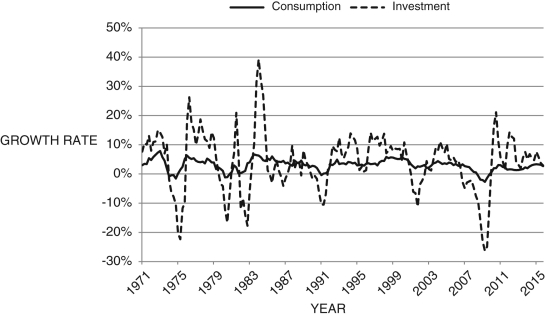 (Source: U.S. Bureau of Economic Analysis)
-Consider Figure 11.1. What explains the difference in the volatility of each series?
A) Firms are predictable.
B) differences in expectations across firms
C) differences in expenditure shares
D) Firms do not make investment decisions based on interest rates.
E) Households consumption-smooth.
Correct Answer:
Verified
Q26: In the equation Q27: Using the IS curve Q28: Consider the following model of the IS Q29: Using the IS curve Q30: In the equation Q32: Refer to the following figure when answering Q33: Refer to the following figure when answering Q34: Refer to the following figure when answering Q35: Refer to the following figure when answering Q36: In the IS curve Unlock this Answer For Free Now! View this answer and more for free by performing one of the following actions Scan the QR code to install the App and get 2 free unlocks Unlock quizzes for free by uploading documents![]()
![]()
![]()
![]()
![]()

