Consider Figure 11.8 below, which shows the output gap and the NASDAQ stock market index from 1995-2001. NASDAQ has a lot of "tech" firms that drove the rise in the stock market index in the late 1990s, as shown. As one can see, the output gap also rose to about 2.8 percent in April 2000. Explain this graph using the IS curve.Figure 11.8: Output Gap and NASDQ Index 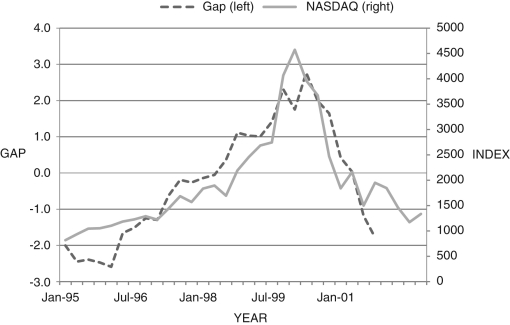
Correct Answer:
Verified
...
View Answer
Unlock this answer now
Get Access to more Verified Answers free of charge
Q118: Consider the United States and Mexico. Both
Q119: Agency problems occur when both parties have
Q120: Consider the following model of the IS
Q121: The deepest the output gap was during
Q122: What is the main conclusion of both
Q123: What do economists generally believe is the
Q125: What should the long-run effect of the
Q126: Explain how the permanent-income hypothesis (PIH) can
Q127: According to the discussion of the Japanese
Q128: Explain what happens to the macroeconomy in
Unlock this Answer For Free Now!
View this answer and more for free by performing one of the following actions

Scan the QR code to install the App and get 2 free unlocks

Unlock quizzes for free by uploading documents