The following table shows real GDP and potential real GDP for the years 2005-2015. Refer to this table when answering the following questions.
Table 10.1 ($ billions) 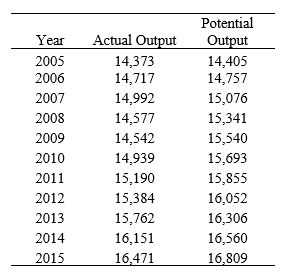 (Source: Federal Reserve Economic Data, St. Louis Federal Reserve)
-During which year was the economy in an expansionary gap?
A) 2001
B) 2004
C) 2002
D) 2003
E) none of the above
Correct Answer:
Verified
Q38: In the middle of 2009, _; by
Q39: The "flight to safety" in the fall
Q40: The _ was hastily designed to _
Q41: IMF studies conducted after the financial crisis
Q42: Refer to the following table when answering
Q44: According to the IMF, which of these
Q45: Which of the following is/are NOT (an)
Q46: Refer to the following table when answering
Q47: When was the recession deepest?
A) 2005
B) 2007
C)
Q48: In a typical recession, generally only _
Unlock this Answer For Free Now!
View this answer and more for free by performing one of the following actions

Scan the QR code to install the App and get 2 free unlocks

Unlock quizzes for free by uploading documents