The following table shows real GDP and potential real GDP for the years 2005-2015. Refer to this table when answering the following questions.
Table 10.1 ($ billions) 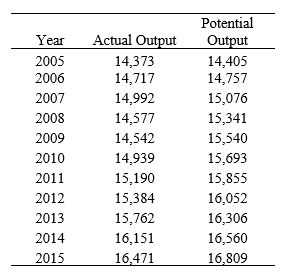 (Source: Federal Reserve Economic Data, St. Louis Federal Reserve)
-About how much did short-run output fluctuations equal in 2005 and 2009, respectively?
A) -0.3 percent; -2.4 percent
B) 0.22 percent; -6.4 percent
C) -33 percent; 323.1 percent
D) 86.1 percent; 83.8 percent
E) Not enough information is given.
Correct Answer:
Verified
Q53: Which of the following countries did the
Q54: The following table shows real GDP and
Q55: Refer to the following table when answering
Q56: According to the IMF, which of these
Q57: From a low of _ percent in
Q59: In terms of loss of employment, which
Q60: One of the key differences between the
Q61: In 1933, the _ was established to
Q62: When a bank's assets cannot cover its
Q63: Net worth is equal to a bank's:
A)
Unlock this Answer For Free Now!
View this answer and more for free by performing one of the following actions

Scan the QR code to install the App and get 2 free unlocks

Unlock quizzes for free by uploading documents