Figure 10.2 shows the U.S. housing price index (solid line, left axis) and one-year adjustable mortgage rates (dashed line, right axis). In the context of the housing and financial crisis, discuss the relationship between these two series.Figure 10.2: Housing Prices and One -Year Adjustable Mortgage Rates 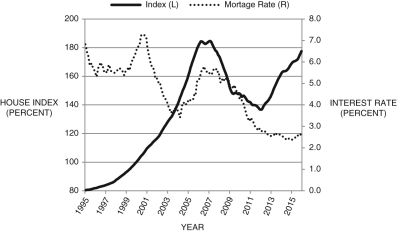
(Source: Federal Reserve Economic II, St. Louis Federal Reserve)
Correct Answer:
Verified
View Answer
Unlock this answer now
Get Access to more Verified Answers free of charge
Q97: The federal funds rate is the rate
Q98: According to The Economist, in 2006, approximately
Q99: A salve to the wounds of the
Q100: Subprime loans are loans made to households
Q101: When depositors rush to get their deposits
Q103: How does "securitizing" assets reduce overall risk?
Q104: Figure 10.4: U.S. Inflation, 2000-2015 
Q105: Explain the relationships between the global savings
Q106: Briefly compare the impact of the Great
Q107: Briefly discuss the macroeconomic outcomes of the
Unlock this Answer For Free Now!
View this answer and more for free by performing one of the following actions

Scan the QR code to install the App and get 2 free unlocks

Unlock quizzes for free by uploading documents