Refer to the following figure when answering the following questions.
Figure 9.1: Output versus Time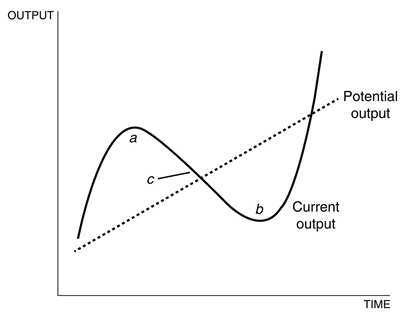
-Considering Figure 9.1:
A) area a is where current output is less than potential output, and area b is where current output is greater than potential output.
B) area a is where current output is greater than potential output, and area b is where current output is less than potential output.
C) point c is where economic fluctuations are zero, and at point b, the economy is in a boom.
D) at point c, current output equals the short-term fluctuations.
E) area a is where current output is greater than potential output, and at point c, the economy is in a boom.
Correct Answer:
Verified
Q25: Since 1950, economic fluctuations in the United
Q26: Suppose an economy exhibits a large unexpected
Q27: If current output is Q28: Suppose an economy exhibits a large unexpected Q29: According to the Phillips curve, short-term changes Q31: Refer to the following figure when answering Q32: Which is responsible for dating business cycles? Q33: According to the text, which of the Q34: Defining Q35: If current output is Unlock this Answer For Free Now! View this answer and more for free by performing one of the following actions Scan the QR code to install the App and get 2 free unlocks Unlock quizzes for free by uploading documents![]()
A)![]()
![]()

