Refer to the following figure when answering the following questions.
Figure 9.2: U.S. Output Fluctuations 1960-2015 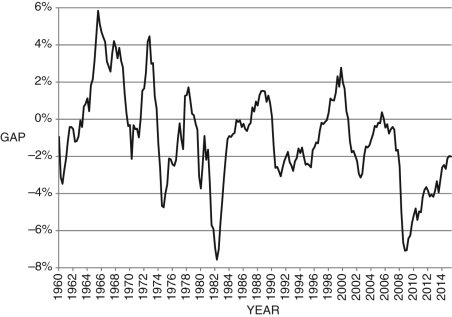
-Consider Figure 9.2. The line represents short-run fluctuations,  . Since 1960, the largest economic "boom" was in about ________ and the deepest recession was in about ________.
A) 1983; 1965
B) 1974; 1976
C) 2000; 1983
D) 1966; 1983
E) The economy always produces at its potential.
Correct Answer:
Verified
Q17: Output fluctuations are defined as:
A) the amount
Q18: The long-run model determines _ output and
Q19: Defining Q20: The short-run model determines _ and _. Q21: According to the data presented in the Q23: Which is responsible for dating business cycles? Q24: According to the text, which of the Q25: Since 1950, economic fluctuations in the United Q26: Suppose an economy exhibits a large unexpected Q27: If current output is ![]()
A)
A)![]()
Unlock this Answer For Free Now!
View this answer and more for free by performing one of the following actions

Scan the QR code to install the App and get 2 free unlocks

Unlock quizzes for free by uploading documents