Refer to the following figure to answer the following questions.
Figure 9.3: Percent Change in U.S. Employment: 1980-2015 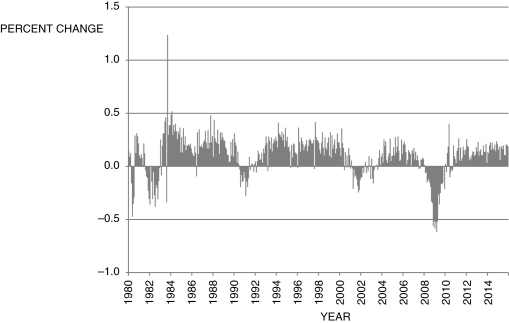
-Based on the data presented in Figure 9.3, which of the following periods is/are likely (an) expansion(s) ?
A) 1988, 2006, and 2014
B) 1988 and 2014
C) 1981, 1990, and 2001
D) 2002
E) Not enough information is given.
Correct Answer:
Verified
Q46: When the U.S. economy bottomed out during
Q47: If Q48: The Phillips curve in the text shows Q49: The short-run model is built on which Q50: If Q52: The Great Depression stimulated _ to write Q53: Refer to the following figure when answering Unlock this Answer For Free Now! View this answer and more for free by performing one of the following actions Scan the QR code to install the App and get 2 free unlocks Unlock quizzes for free by uploading documents![]()
![]()

