Refer to the following figure when answering the following questions.
Figure 9.5: U.S. Inflation 1960-2015 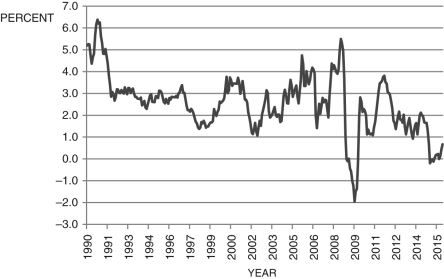 (Source: Bureau of Labor Statistics)
-Consider Figure 9.5, which shows the annual inflation rate. According to the Phillips curve, the period from about 2009 to 2010 was a period of:
A) a slumping economy.
B) a booming economy.
C) stagnation.
D) macroeconomic equilibrium.
E) Not enough information is given.
Correct Answer:
Verified
Q57: If Q58: Refer to the following figure when answering Q59: Refer to the following figure to answer![]()
Unlock this Answer For Free Now!
View this answer and more for free by performing one of the following actions

Scan the QR code to install the App and get 2 free unlocks

Unlock quizzes for free by uploading documents