True/False
Figure 9.6: Economic Boom versus Recession 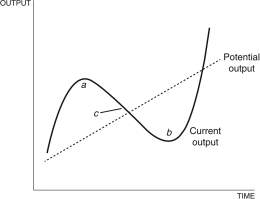
-In Figure 9.6 above, area b represents an economic boom, and area a is a recession.
Correct Answer:
Verified
Related Questions
Q85: Defining Q86: Defining Q87: Defining Q88: Defining u as the unemployment rate and Q89: You are a staff economist with the Q91: Post-World War II, the deepest recessionary gap Q92: The relationship between actual output in an Q93: The Phillips curve shows the negative relationship Q94: The relationship between actual output in an Q95: According to the text, the slope of Unlock this Answer For Free Now! View this answer and more for free by performing one of the following actions Scan the QR code to install the App and get 2 free unlocks Unlock quizzes for free by uploading documents![]()
![]()
![]()

