Table 8.1 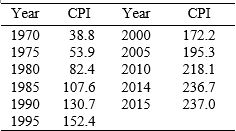
(Source: U.S. Bureau of Labor Statistics)
Considering the end-of-year CPI data in Table 8.1:
(a) Calculate the rate of inflation between 1970 and 1975 and between 1995 and 2000.
(b) Calculate the average rate of inflation for 1970-1975 and 1970-1980.
(c) Calculate the average rate of inflation for 2000-2010 and 2014-2015.
(d) Briefly comment on your results.
Correct Answer:
Verified
For 1970-1975:
1...
View Answer
Unlock this answer now
Get Access to more Verified Answers free of charge
Q107: In times of high inflation, shoe-leather costs
Q108: If a bank offers you a 30-year
Q109: Table 8.2: Monetary Aggregates (in billions)
Q110: Briefly discuss what makes up the monetary
Q111: Below is the three-year bond real interest
Q113: Briefly explain the cause of the Great
Q114: Table 8.3 contains the following variables, growth
Q115: In the United States, decisions about monetary
Q116: The high rate of inflation in the
Q117: If all goods' prices adjust simultaneously, there
Unlock this Answer For Free Now!
View this answer and more for free by performing one of the following actions

Scan the QR code to install the App and get 2 free unlocks

Unlock quizzes for free by uploading documents