The figure below shows the three-month bond yield (solid line) and the inflation rate (dashed). Discuss what has happened to the real three-month bond yield over the period shown, 2003-2015. Are there any "unusual" occurrences over this period?Figure 8.3: Nominal Three-Month Yield and Inflation 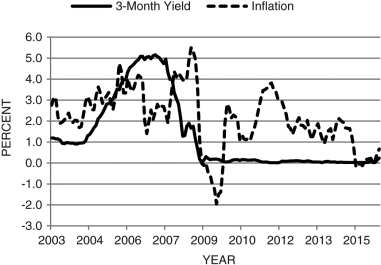
Correct Answer:
Verified
View Answer
Unlock this answer now
Get Access to more Verified Answers free of charge
Q97: Economists often use a rate of inflation
Q98: The costs associated with changing prices are
Q99: The cure for hyperinflation is:
A) reducing money
Q100: Compared to the real interest rate, the
Q101: Explain how increases in government expenditures can
Q103: Inflationary surprises transfer wealth from lenders to
Q104: Write down the quantity equation in growth
Q105: The Federal Reserve believed that the productivity
Q106: The right to seigniorage is the right
Q107: In times of high inflation, shoe-leather costs
Unlock this Answer For Free Now!
View this answer and more for free by performing one of the following actions

Scan the QR code to install the App and get 2 free unlocks

Unlock quizzes for free by uploading documents