Refer to the following figure when answering the following questions.
Figure 7.2: United Kingdom Unemployment Rate: 1971-2015 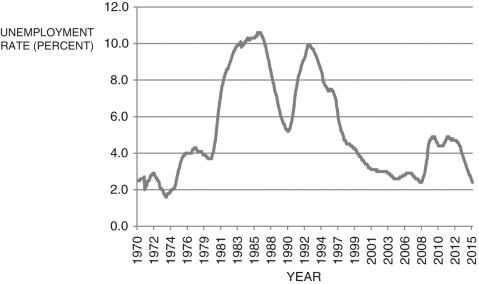 (Source: OECD and Federal Reserve Economic Data, Federal Reserve Bank of St. Louis)
-Given the U.K. unemployment rate data depicted in Figure 7.2, the year of the trough of a recession was:
A) 1991.
B) 2006.
C) 1981.
D) 1973.
E) 1993.
Correct Answer:
Verified
Q20: The quote "It's a recession when your
Q21: In the labor market depicted in Figure
Q22: A decrease in the income tax will
Q23: If the income taxes on wages increase,
Q24: Most of the total weeks of lost
Q26: In the labor market depicted in Figure
Q27: In March 2016, the United States imposed
Q28: An increase in labor regulations results in:
A)
Q29: The demand for labor curve is:
A) downward
Q30: The explanation for the upward-sloping supply of
Unlock this Answer For Free Now!
View this answer and more for free by performing one of the following actions

Scan the QR code to install the App and get 2 free unlocks

Unlock quizzes for free by uploading documents