Figure 7.6: Labor Force Participation Rate: 2000-2015 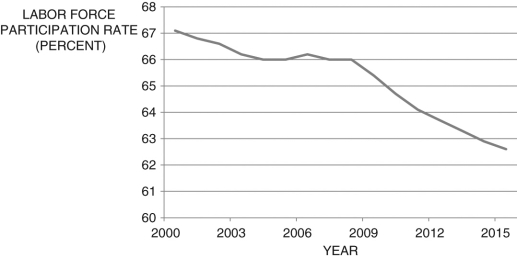
-
Consider the following data (in thousands): 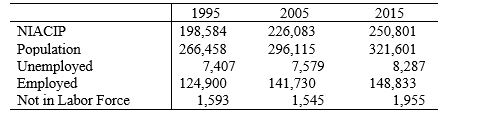
For each period:
(a) Calculate the labor force participation rate.
(b) Calculate the unemployment rate. Based solely on the data provided, what might be a "logical" estimate of the natural rate of unemployment?
(c) Calculate the employment-population ratio.
(d) What is the number of discouraged workers?
(e) Comment on your results.
(f) Now, consider Figure 7.6 above. What might explain the decline in the labor participation rate from 2000 to 2015?
Correct Answer:
Verified
(a) LFPR...
View Answer
Unlock this answer now
Get Access to more Verified Answers free of charge
Q106: Of the richest countries, the Japanese spend
Q107: If the minimum wage is set below
Q108: What has been happening to cause returns
Q109: The idea that you value receiving $1,000
Q110: Leading up to the 2010 midterm elections,
Q112: According to the text, France of income
Q113: The natural rate of unemployment is equal
Q114: The present discounted value equation 
Q115: One explanation for the college wage premium
Q116: In the "bathtub model" of unemployment, the
Unlock this Answer For Free Now!
View this answer and more for free by performing one of the following actions

Scan the QR code to install the App and get 2 free unlocks

Unlock quizzes for free by uploading documents