Figure 6.1: Romer Model: Per Capita Output 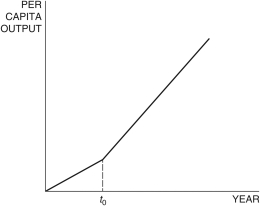
-In the Romer model in Figure 6.1, at time t0, a change in the growth rate of per capita output can be explained by a(n) :
A) decrease in the ideas efficiency parameter.
B) increase in the population.
C) increase in the share of labor engaged in research.
D) increase in the saving rate.
E) decrease in the population.
Correct Answer:
Verified
Q57: Nonrivalry in the Romer model means that
Q58: A balanced growth path is defined as
Q59: Suppose the Romer model parameters in East
Q60: In the Romer model, the Mexican economy:
A)
Q61: Even if there are decreasing returns to
Q63: According to the Case Study on Globalization
Q64: In the combined Solow-Romer model, the growth
Q65: "Growth accounting" endeavors to:
A) measure GDP.
B) measure
Q66: For the years 2011-2015, if output per
Q67: Figure 6.2: Romer Model: Per Capita Output
Unlock this Answer For Free Now!
View this answer and more for free by performing one of the following actions

Scan the QR code to install the App and get 2 free unlocks

Unlock quizzes for free by uploading documents