Figure 6.2: Romer Model: Per Capita Output 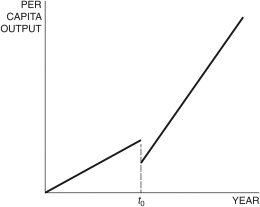
-In the Romer model in Figure 6.2, at time t0, a change in the shape of the production function can be explained by an increase in the:
A) population.
B) share of labor engaged in research.
C) ideas efficiency parameter.
D) saving rate.
E) growth rate.
Correct Answer:
Verified
Q70: For the years 1995-2007, if output per
Q71: In the growth accounting equation, 
Q72: Figure 6.2: Romer Model: Per Capita Output
Q73: In the growth accounting equation,
Q74: Labor composition is used in "growth accounting"
Q76: In the Romer model, with decreasing returns
Q77: In the combined Solow-Romer model, long-run growth
Q78: Figure 6.2: Romer Model: Per Capita Output
Q79: In growth accounting, the residual, gA, is
Q80: According to the combined Solow-Romer model, all
Unlock this Answer For Free Now!
View this answer and more for free by performing one of the following actions

Scan the QR code to install the App and get 2 free unlocks

Unlock quizzes for free by uploading documents