Refer to the following figure when answering the following questions.
Figure 5.1: Solow Diagram 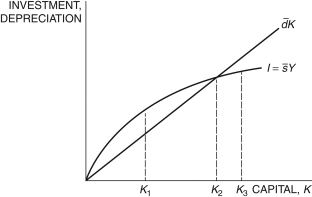
-In Figure 5.1, the capital stock at K1 is not the steady state because:
A) the saving rate is too low.
B) the saving rate is too high.
C) the depreciation rate is too low.
D) gross investment is higher than capital depreciation.
E) gross investment is lower than capital depreciation.
Correct Answer:
Verified
Q26: Refer to the following figure when answering
Q27: The Solow model assumes the:
A) capital stock
Q28: In the Solow model, investment, It, as
Q29: The Solow model assumes the saving rate
Q30: Refer to the following figure when answering
Q32: Capital accumulation is a(n):
A) stock.
B) flow.
C) final
Q33: The amount of capital in an economy
Q34: Refer to the following figure when answering
Q35: The equation Q36: The steady state is defined as![]()
Unlock this Answer For Free Now!
View this answer and more for free by performing one of the following actions

Scan the QR code to install the App and get 2 free unlocks

Unlock quizzes for free by uploading documents