Refer to the following figure when answering the following questions.
Figure 5.3: Solow Diagram 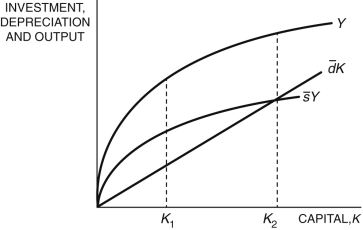
-In Figure 5.3, at K1, the difference between  and
and 
Is ________, and the difference between Y and 
Is ________.
A) output; investment
B) net investment; consumption
C) gross investment; consumption
D) output; consumption
E) depreciation; gross investment
Correct Answer:
Verified
Q42: An increase in _ leads to a
Q43: Refer to the following figure when answering
Q44: The steady-state level of output per worker
Q45: In the standard production model's production function,
Q46: In the Solow model, if capital is
Q48: Assume a production function is given by
Q49: Assume a production function is given by
Q50: According to the Solow model, in the
Q51: In the Solow model, it is assumed
Q52: Over the past 30 years, _ has
Unlock this Answer For Free Now!
View this answer and more for free by performing one of the following actions

Scan the QR code to install the App and get 2 free unlocks

Unlock quizzes for free by uploading documents