Refer to the following figure when answering the following questions.
Figure 5.4: Solow Diagram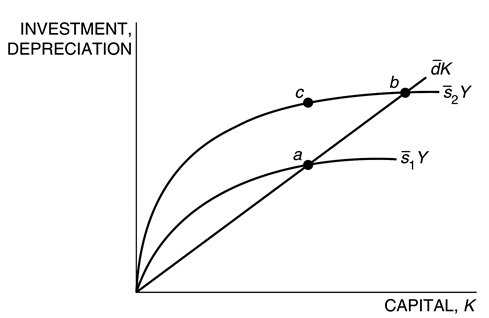
-Consider the Solow model exhibited in Figure 5.4. If a country's saving rate increases from s1 to s2, the economy would:
A) move from point a to point b.
B) move from point c to point a.
C) move from point c to point b.
D) move from point a to point c.
E) stay at point b.
Correct Answer:
Verified
Q73: If we define Q74: A decline in the saving rate causes Q75: An implication of the Solow model is Q76: If the depreciation and saving rates are Q77: Assume two economies are identical in every Q79: In the Solow model, if we assume Q80: Suppose you are given the data for Q81: Refer to the following figure when answering Q82: Refer to the following figure when answering Q83: In the Solow model, if gross investment![]()
Unlock this Answer For Free Now!
View this answer and more for free by performing one of the following actions

Scan the QR code to install the App and get 2 free unlocks

Unlock quizzes for free by uploading documents