Refer to the following figure when answering the following questions.
Figure 5.5: Solow Diagram 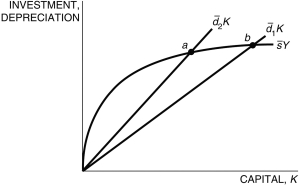
-Figure 5.5 represents two countries, 1 and 2. Country ________ has a higher depreciation rate and, therefore, has a ________ steady state than the other country.
A) 1; higher
B) 1; lower
C) 2; higher
D) 2; lower
E) Not enough information is given.
Correct Answer:
Verified
Q62: Refer to the following figure when
Q63: Immediately following the increase in the saving
Q64: In the Solow model, saving and investing
Q65: Refer to the following figure when answering
Q66: Refer to the following figure when answering
Q68: In the Solow model, with population growth:
A)
Q69: Which of the following best answers whether
Q70: A central lesson of the Solow model
Q71: In the Solow model, if a country's
Q72: If we define ![]()
Unlock this Answer For Free Now!
View this answer and more for free by performing one of the following actions

Scan the QR code to install the App and get 2 free unlocks

Unlock quizzes for free by uploading documents