Refer to the following table when answering the following questions.
Table 4.1: Production Model's Prediction for Per Capita GDP (US = 1) 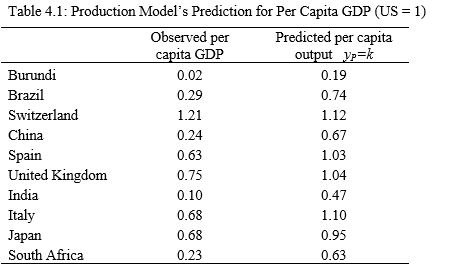 (Source: Penn World Tables 9.0)
-One explanation for the difference between the predicted output per person and the observed per capita GDP in Table 4.1 is differences in:
A) per capita capital.
B) the labor supply.
C) factor productivity.
D) labor's share of GDP.
E) None of these answers is correct.
Correct Answer:
Verified
Q73: Refer to the following table when answering
Q74: In the Cobb-Douglas production function 
Q75: You are an economist working for the
Q76: In the Cobb-Douglas production function
Unlock this Answer For Free Now!
View this answer and more for free by performing one of the following actions

Scan the QR code to install the App and get 2 free unlocks

Unlock quizzes for free by uploading documents