(Figure: Home's Import-Competing Industry) How would we measure the "gains" from trade in this diagram? 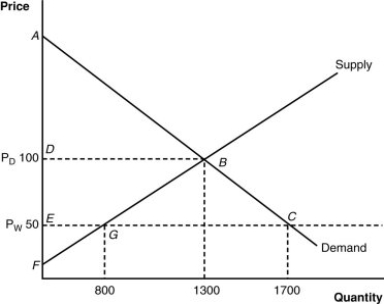
A) triangle AFB
B) triangle AEC
C) quadrangle DECB (consumer gains) - DEBG (producer losses)
D) triangle EFC
Correct Answer:
Verified
Q66: Suppose that the free-trade price of a
Q67: The following table gives the hypothetical supply
Q68: The home import demand curve is downward
Q69: (Figure: Home's Import-Competing Industry) Based on the
Q70: Suppose that the free-trade price of a
Q72: The following table gives the hypothetical supply
Q73: If S = 1P represents a country's
Q74: The following table gives the hypothetical supply
Q75: Suppose that the equations S = 2P
Q76: The following table gives the hypothetical supply
Unlock this Answer For Free Now!
View this answer and more for free by performing one of the following actions

Scan the QR code to install the App and get 2 free unlocks

Unlock quizzes for free by uploading documents