The following graph shows the relationship between a large country importer of a good, say steel, and its tariff rate (in percentages). Explain why the curve reaches maximum and then declines. 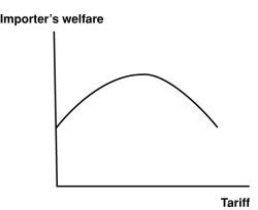
Correct Answer:
Verified
Q171: The expiration of the Multifibre Arrangement in
Q172: Why did no U.S. tire producer support
Q173: I. Is a country a small or
Q174: How high was the U.S. tariff on
Q175: If the United States is a large
Q177: Explain why the exporting foreign country will
Q178: The following equations represent a small country's
Q179: Suppose that the U.S. government imposes quotas
Q180: Downgrading refers to:
A) the slope of the
Q181: Several instances of U.S. agreements with its
Unlock this Answer For Free Now!
View this answer and more for free by performing one of the following actions

Scan the QR code to install the App and get 2 free unlocks

Unlock quizzes for free by uploading documents