(Figure: Home's Exporting Industry I) The graph shows information about a small home exporter. D is home demand and S is home supply. 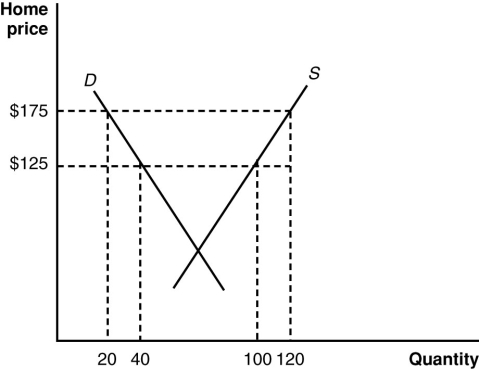 According to the graph, at the world price of $125 there is a ________ of ____ in the home market, which is ____.
A) surplus; 60; imported
B) shortage; 60; imported
C) surplus; 60; exported
D) shortage; 100; exported
Correct Answer:
Verified
Q24: (Scenario: Demand and Supply for Iron Ore)
Q25: Suppose that the world price of sugar
Q26: Suppose that the world price of sugar
Q27: (Scenario: Sugar Trade in Birdonia) In autarky,
Q28: When assessing the welfare effect of an
Q30: (Figure: Home's Exporting Industry I) The graph
Q31: (Scenario: Demand and Supply for Iron Ore)
Q32: (Figure: Home's Exporting Industry I) The graph
Q33: (Scenario: Demand and Supply for Iron Ore)
Q34: (Scenario: Sugar Trade in Birdonia) In autarky,
Unlock this Answer For Free Now!
View this answer and more for free by performing one of the following actions

Scan the QR code to install the App and get 2 free unlocks

Unlock quizzes for free by uploading documents