(Figure: Home's Exporting Industry I) The graph shows information about a small home exporter. D is home demand and S is home supply. 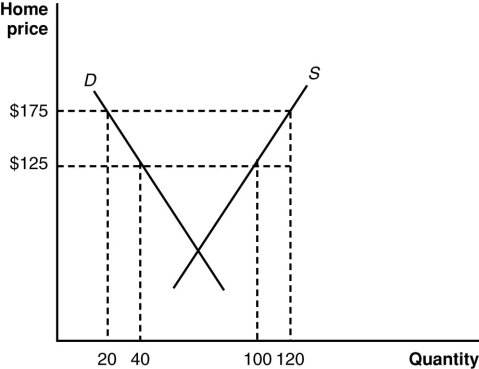 According to the graph, when the home country provides a subsidy of _______, exports will increase by _____ units.
A) $50; 40
B) $175; 120
C) $125; 100
D) $175; 100
Correct Answer:
Verified
Q17: Which of the following is NOT an
Q18: An export subsidy works to _ the
Q19: Which of the following will happen when
Q20: Under terms of the 2015 WTO, when
Q21: (Scenario: Sugar Trade in Birdonia) In autarky,
Q23: (Figure: Home's Exporting Industry I) The graph
Q24: (Scenario: Demand and Supply for Iron Ore)
Q25: Suppose that the world price of sugar
Q26: Suppose that the world price of sugar
Q27: (Scenario: Sugar Trade in Birdonia) In autarky,
Unlock this Answer For Free Now!
View this answer and more for free by performing one of the following actions

Scan the QR code to install the App and get 2 free unlocks

Unlock quizzes for free by uploading documents