(Figure: Home's Exporting Industry II) The graph shows the effect of a subsidy on a large country. D describes home demand and S describes home supply. 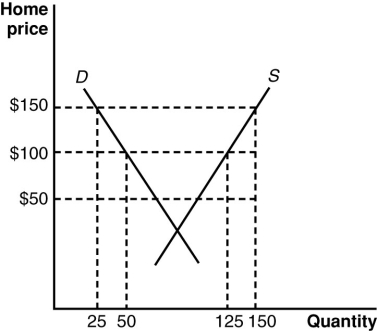 According to the figure, if the world price of the product is $100, the home demand for the product is _____ and the exports are ______.
A) 25; 125
B) 25; 25
C) 50; 75
D) 25; 75
Correct Answer:
Verified
Q46: Suppose that the world price of sugar
Q47: If a large nation subsidizes its exports,
Q48: Suppose that the world price of sugar
Q49: (Scenario: Freedonian Exports) In the small country
Q50: What happens to the large country's domestic
Q52: (Scenario: Freedonian Exports) In the small country
Q53: (Figure: Home's Exporting Industry II) The graph
Q54: (Scenario: Freedonian Exports) In the small country
Q55: (Scenario: Freedonian Exports) In the small country
Q56: (Figure: Home's Exporting Industry II) The graph
Unlock this Answer For Free Now!
View this answer and more for free by performing one of the following actions

Scan the QR code to install the App and get 2 free unlocks

Unlock quizzes for free by uploading documents