(Figure: Home's Exporting Industry II) The graph shows the effect of a subsidy on a large country. D describes home demand and S describes home supply. 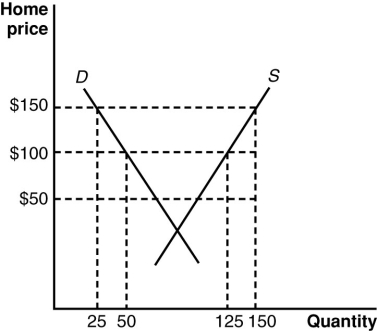 According to the graph, what is the home deadweight loss due to the $100 export subsidy?
A) $12,500
B) $625
C) $1,250
D) $5,000
Correct Answer:
Verified
Q54: (Scenario: Freedonian Exports) In the small country
Q55: (Scenario: Freedonian Exports) In the small country
Q56: (Figure: Home's Exporting Industry II) The graph
Q57: (Figure: Home's Exporting Industry II) The graph
Q58: Suppose that the world price of sugar
Q60: (Scenario: Freedonian Exports) In the small country
Q61: Because of the harm caused to low-income
Q62: Suppose that the world price of sugar
Q63: Why do countries subsidize exports when they
Q64: Who will lose as a result of
Unlock this Answer For Free Now!
View this answer and more for free by performing one of the following actions

Scan the QR code to install the App and get 2 free unlocks

Unlock quizzes for free by uploading documents