Figure 6.1 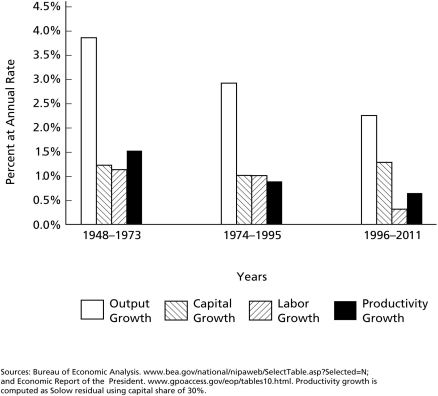
-According to Figure 6.1,the average annual rate of growth of the U.S.economy in the period 1948-73 equalled ________.
A) 1.8 percent
B) 4.0 percent
C) 39 percent
D) 697 percent
Correct Answer:
Verified
Q68: Figure 6.1 Q69: Figure 6.1 Q70: Economic growth _. Q71: National output is a function of _. Q72: The growth accounting equation suggests that the Q74: Productivity is _. Q75: Capital and labor are distinct from productivity Q76: Which of the following is the most Q77: The slowdown in U.S.economic growth in the Q78: Productivity growth can be measured _.![]()
![]()
A)is driven by different elements
A)capital
A)determined by central bank policy
B)the
A)by dividing
Unlock this Answer For Free Now!
View this answer and more for free by performing one of the following actions

Scan the QR code to install the App and get 2 free unlocks

Unlock quizzes for free by uploading documents