Figure 6.1 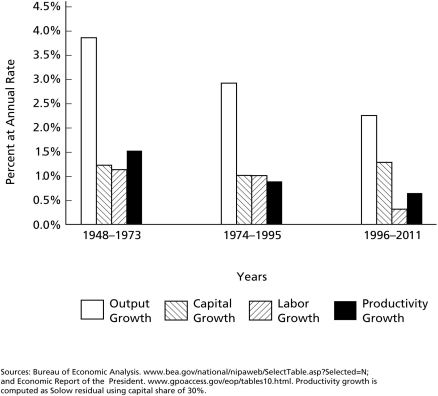
-According to Figure 6.1,the period from 1974 to 1995 is particularly remarkable for the slow growth of ________.
A) output per worker
B) labor input
C) output
D) capital input
Correct Answer:
Verified
Q64: There are no questions for this section.
6.7
Q65: Figure 6.1 Q66: A major contribution of the Solow model Q67: Figure 6.1 Q68: Figure 6.1 Q70: Economic growth _. Q71: National output is a function of _. Q72: The growth accounting equation suggests that the Q73: Figure 6.1 Q74: Productivity is _. Unlock this Answer For Free Now! View this answer and more for free by performing one of the following actions Scan the QR code to install the App and get 2 free unlocks Unlock quizzes for free by uploading documents![]()
![]()
![]()
A)is driven by different elements
A)capital![]()
A)determined by central bank policy
B)the

