Figure 13.1 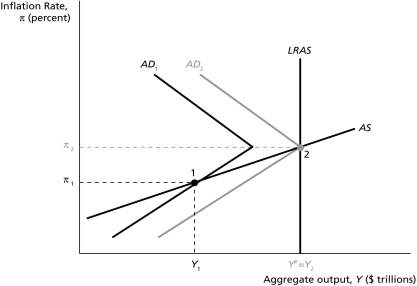
-In Figure 13.1,"the zero lower bound" is displayed at ________.
A) point 1
B) point 2
C) 
D) the origin (intersection of the axes)
E) none of the above
Correct Answer:
Verified
Q81: Nonconventional monetary policy attempts to reduce financial
Q82: A goal of very high employment may
Q84: In the 1965 to 1973 period,U.S.policymakers _.
A)targeted
Q88: How might strict adherence to the Taylor
Q91: The key difference between "quantitative easing" and
Q92: After 1975,the U.S.economy continued to experience high
Q93: When the credit spread rises,an effective policy
Q96: How might strict adherence to the Taylor
Q99: An increase in financial frictions results in
Q100: An increase in financial frictions results in
Unlock this Answer For Free Now!
View this answer and more for free by performing one of the following actions

Scan the QR code to install the App and get 2 free unlocks

Unlock quizzes for free by uploading documents