Exhibit: Steady-State Capital-Labor Ratio 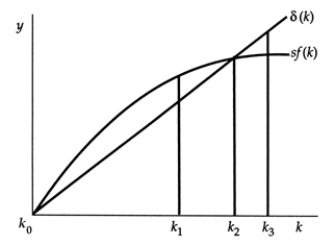 In this graph, the capital-labor ratio that represents the steady-state capital-ratio is:
A) k0.
B) k1.
C) k2.
D) k3.
Correct Answer:
Verified
Q19: In the Solow growth model of Chapter
Q20: When f(k) is drawn on a graph
Q21: A higher saving rate leads to a:
A)
Q22: In the Solow growth model, if investment
Q23: In the Solow growth model with no
Q25: In the Solow growth model, if investment
Q26: The Solow model shows that a key
Q27: The formula for steady-state consumption per
Q28: In the Solow growth model, the steady-state
Q29: In the Solow growth model, with a
Unlock this Answer For Free Now!
View this answer and more for free by performing one of the following actions

Scan the QR code to install the App and get 2 free unlocks

Unlock quizzes for free by uploading documents