Use the following to answer question : 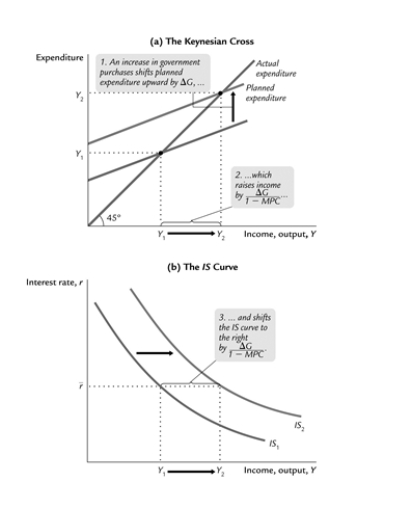
-The above diagram shows how a rise in government expenditure (G) shifts the IS curve from IS1 to IS2. What are the levels of investments in Y1 and Y2?
Correct Answer:
Verified
View Answer
Unlock this answer now
Get Access to more Verified Answers free of charge
Q109: Explain what force moves the market back
Q110: a. As an economy moves into
Q111: a. Graphically illustrate how an increase in
Q112: Two identical countries, Country A and Country
Q113: Assume that the equilibrium in the
Q115: a. The interest rate affects which variable
Q116: Explain why an increase in the money
Q117: Compare the predicted impact of an increase
Q118: How can the government expenditure multiplier be
Q119: During a recession, consumers may want to
Unlock this Answer For Free Now!
View this answer and more for free by performing one of the following actions

Scan the QR code to install the App and get 2 free unlocks

Unlock quizzes for free by uploading documents