Figure 6.3.1 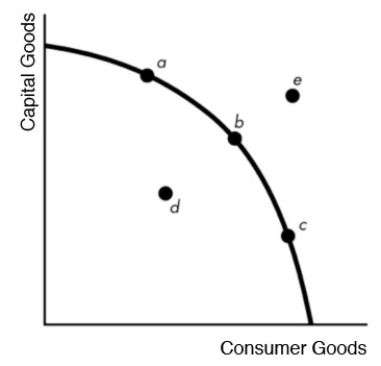
-Look at the macro production possibilities frontier in Figure 6.3.1. Which point(s) represent real GDP less than potential GDP?
A) a only
B) b only
C) a, b, c
D) d only
E) e only
Correct Answer:
Verified
Q9: The long run is a period of
Q10: The long run is a period of
Q11: On the graph of the macro production
Q12: Figure 6.3.1 Q13: The short run is a period of Q15: The long-run aggregate supply curve (LAS) is Q16: Full employment is represented by points 1 Q17: The targets for a macro economy that Q18: Potential GDP is represented by points 1 Q19: Figure 6.3.1 ![]()
![]()
Unlock this Answer For Free Now!
View this answer and more for free by performing one of the following actions

Scan the QR code to install the App and get 2 free unlocks

Unlock quizzes for free by uploading documents