Examine Figure 49.7 below and compare the projected change in temperature in central South America and central Africa at the equator (draw an imaginary line across the globe at its widest point and examine a spot in the middle of each continent along that line) . Which of the following BEST describes the predicted changes? 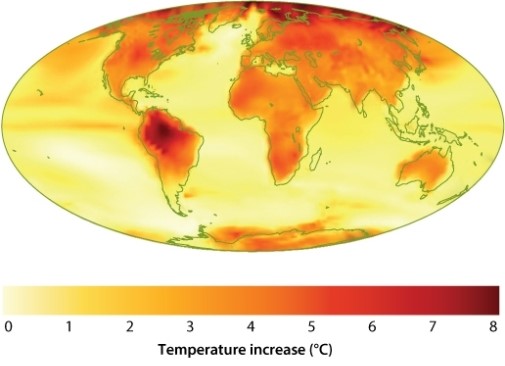
A) Central South America will warm by an average of 7-8 degrees; central Africa will warm by around 3-4 degrees.
B) Central South America will warm by an average of more than 8 degrees; central Africa will warm by 1-2 degrees.
C) Central South America will remain about the same; central Africa will warm by 7-8 degrees.
D) Central South America will warm by 2-3 degrees; central Africa will not change.
E) Both central South America and central Africa will warm by 4-5 degrees.
Correct Answer:
Verified
Q20: A college student walks down New York
Q21: If you were studying the effects of
Q22: A number of plant species have declined
Q23: Using records taken by Henry David Thoreau
Q24: When the ecological footprints of every human
Q26: Humans have a nearly ubiquitous influence on
Q27: Carbon dioxide combines with water to form
Q28: Geoengineering consists of a suite of widely
Q29: Giant sequoia trees (Sequoiadendron giganteum) are among
Q30: About _ of the CO2 produced by
Unlock this Answer For Free Now!
View this answer and more for free by performing one of the following actions

Scan the QR code to install the App and get 2 free unlocks

Unlock quizzes for free by uploading documents