Consider the figure below showing calculated sustainable yield for Peruvian anchovy. 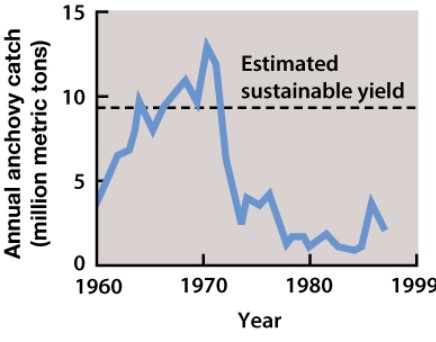 For years Peruvian anchovy were fished at their estimated sustainable yield. Which of the following is the BEST explanation for why the population crashed?
A) Individuals stopped eating anchovy, so anchovies lowered their reproductive rates.
B) The estimated sustainable yield was calculated at the maximum population size of Peruvian anchovy.
C) Predators of Peruvian anchovy increased in population size.
D) All of these choices are correct.
Correct Answer:
Verified
Q97: Continuous adaptation will be necessary just to
Q98: Eutrophication describes the:
A)process in which added nutrient
Q99: If all other aspects of their lifestyles
Q100: Humans add about 150,000,000 tons of fixed
Q101: Clearcutting for grazing and croplands has destroyed
Q103: Amphibian population declines have been linked to:
A)habitat
Q104: A dead zone has been documented off
Q105: What factors promote the recent spread of
Q106: Many species are introduced into new areas
Q107: Wheat is a group of grass species.
Unlock this Answer For Free Now!
View this answer and more for free by performing one of the following actions

Scan the QR code to install the App and get 2 free unlocks

Unlock quizzes for free by uploading documents