Which of the following is an appropriate interpretation of the graph below? 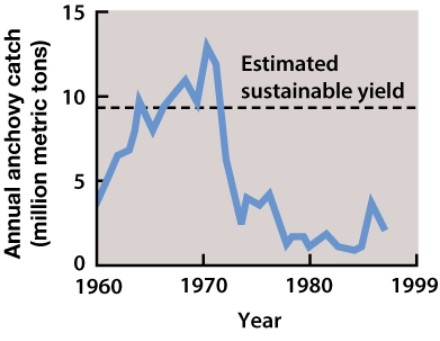
A) The anchovy catch grew through 1970, after which there was rapid decline without recovery.
B) The anchovy population grew through about 1970, after which there was a rapid decline without recovery.
C) The anchovy catch increases to 10 million metric tons every 30 years; it peaked again in 2000.
D) This graph represents populations of predator/prey cycles.
E) The estimated sustainable yield represents the anchovy population size after recovery from overexploitation.
Correct Answer:
Verified
Q122: Approximately what percentage of our planet's land
Q123: Which of the following statements about invasive
Q124: Invasive species spread to new areas through
Q125: A major cause of biodiversity loss is
Q126: Some forms of M. tuberculosis are very
Q128: A scientist is studying a population of
Q129: Humans have changed the selective landscape of
Q130: The populations of all species except humans
Q131: Which of the following is responsible for
Q132: An invasive species is:
A)any non-native species that
Unlock this Answer For Free Now!
View this answer and more for free by performing one of the following actions

Scan the QR code to install the App and get 2 free unlocks

Unlock quizzes for free by uploading documents